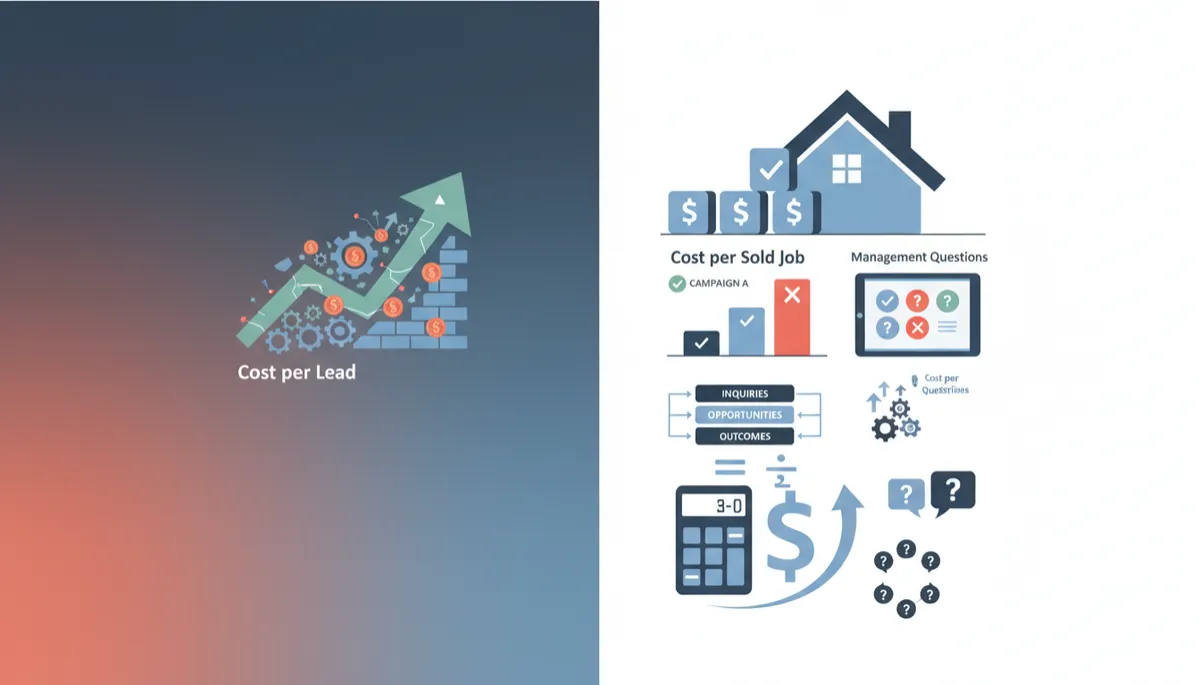
Track Cost Per Sold Job for Roofing Success
Roofing Growth, Marketing Metrics, Profitability
Why Roofing Companies Should Track Cost Per Sold Job, Not Cost Per Lead
If you are running a roofing company between $2M and $10M, you cannot afford to manage your marketing on vanity metrics. Cost per lead feels useful, but it is too far from the result you actually care about: profitable, installed jobs. You need to manage to cost per sold job if you want consistent growth and predictable cash flow.
Why Cost Per Sold Job Beats Cost Per Lead: A Simple Comparison
In this hypothetical example, consider two campaigns running in the same month with a $10,000 advertising spend each. Management time, creative, software, and other marketing costs are not included in these figures.
Campaign A: 200 leads at $50 media cost per lead, but only 10 sold jobs.
Campaign B: 80 leads at $125 media cost per lead, but 20 sold jobs.
If you manage by cost per lead, Campaign A appears to win at $50 cost per lead versus $125 cost per lead. When you look at media cost per sold job, the picture changes.
Metric | Campaign A | Campaign B |
|---|---|---|
Advertising Spend | $10,000 | $10,000 |
Leads Generated | 200 | 80 |
Sold Jobs | 10 | 20 |
Media Cost per Lead | $50 | $125 |
Media Cost per Sold Job | $1,000 | $500 |
Campaign B acquires signed jobs at half the advertising cost in this illustration. This is why owners who manage by cost per lead routinely scale the wrong campaigns and starve the right ones. Cost per sold job is closer to the business outcome you are actually buying with your ad dollars.
To make the illustration concrete, assume each signed job represents one new customer, all jobs complete within the evaluation period, the average completed job revenue is $15,000, and contribution per job is $4,500 after incremental selling and delivery costs but before marketing and fixed overhead. Campaign A produces $150,000 completed job revenue and $45,000 contribution before marketing. Campaign B produces $300,000 completed job revenue and $90,000 contribution before marketing. After advertising alone, $35,000 and $80,000 remain respectively, before other marketing costs, fixed overhead, and expenses not already included. These are not net profit figures, but they show how different media cost per sold job levels translate into very different contribution after advertising.
Clear Definitions: Metrics and Their Denominators
To manage like an executive, you need precise definitions. Use these across your company and with every vendor, and keep the cost bases and lead groups consistent.
Media Cost per Lead = Advertising Spend ÷ Number of Leads. Denominator: leads in the group attributed to that advertising. Includes media spend only, not management, creative, software, or other marketing costs.
Total Marketing Cost per Lead = Total Marketing Cost ÷ Number of Leads. Denominator: leads. Total marketing cost includes advertising, management, creative, software, and other marketing expenses tied to that lead group.
Media Cost per Sold Job = Advertising Spend ÷ Number of Sold Jobs from that Source. Denominator: sold jobs that came from the attributed lead group.
Total Marketing Cost per Sold Job = Total Marketing Cost ÷ Number of Sold Jobs from that Source. Denominator: sold jobs. Uses the same set of attributed leads and the same time frame as the cost per lead calculation.
Full Customer Acquisition Cost = (Total Marketing Cost + Applicable Sales Acquisition Costs) ÷ Number of New Customers Acquired. Denominator: new customers whose projects were acquired through that set of efforts. Includes marketing and applicable sales costs tied to acquisition, not delivery or long term service.
Marketing Cost per Completed Job = Total Marketing Cost ÷ Number of Completed Jobs from that Source. Denominator: completed jobs that can be tied back to the same attributed lead group.
Cost per Lead (CPL) = Marketing Spend ÷ Number of Leads. Denominator: leads (unique contact records who raised their hand). When you are using marketing spend that includes more than media, keep the definition clear in your reporting.
Cost per Sold Job = Marketing Spend ÷ Number of Sold Jobs from that Source. Denominator: sold jobs (signed contracts tied back to the original campaign). With a consistent lead group and time frame, you can also express this as cost per sold job = cost per lead ÷ lead to sold job rate.
Lead to Opportunity Rate = Qualified Opportunities ÷ Leads. Denominator: leads. Tracks how many leads become qualified opportunities based on your criteria.
Opportunity to Sale Rate = Sold Jobs ÷ Qualified Opportunities. Denominator: qualified opportunities. Tracks how many qualified opportunities progress to signed contracts.

A simple scorecard gives your team one version of the truth on marketing performance.
The ActivatorSystem Lead to Job Scorecard: Four Management Questions
At ActivatorSystem, we use a Lead to Job Scorecard to connect your advertising, follow up, and sales into one clear view. As an owner, you should be able to answer four core questions for every channel, every month, and then extend the view through to completed jobs and contribution.
How many inquiries did we generate? Raw responses from each campaign.
How many became qualified opportunities and moved through key stages? Track qualified opportunity, appointment booked, inspection completed, estimate delivered, contract signed, job completed, and payment collected separately.
How many sold jobs and completed jobs came out the other side? Signed contracts and completed jobs, tagged to the source, with cancellations and lost opportunities visible.
What were our cost per sold job and contribution after marketing? Total marketing spend and advertising spend divided by sold jobs and completed jobs, alongside contribution after marketing for that campaign.
When your leadership team reviews this expanded scorecard weekly or monthly, decisions become more grounded. Cost per sold job supports decisions about what to scale, fix, or cut, but it does not alone establish profitability or justify scaling. You also need to see cancellations, completed jobs, contribution after marketing, and how those results compare with your capacity and financial targets.
Understanding the Conversion Chain and Cost per Sold Job
Your marketing and sales process is a sequence: Inquiries → Qualified Opportunities → Appointments Booked → Inspections Completed → Estimates Delivered → Contracts Signed → Jobs Completed → Payments Collected. Each stage has a conversion rate that compounds down the line.
If you improve the movement from inquiry to qualified opportunity, you lower your cost per qualified opportunity and cost per sold job, provided that downstream conversion from qualified opportunity to signed contract and from signed contract to completed job holds.
If you improve the movement from qualified opportunity to contract signed, you drive down cost per sold job. If you improve the movement from contract signed to job completed while marketing spending and the number of signed contracts stay the same, you reduce marketing cost per completed job, not cost per sold job.
Mathematically, for any campaign, with a consistent lead group and time frame:
Cost per Sold Job = Marketing Spend ÷ Sold Jobs.
Sold Jobs = Leads × (Lead to Opportunity Rate) × (Opportunity to Sale Rate).
This is why ActivatorSystem focuses on the full system, including advertising, follow up, and the sales process, not just more leads. The leverage is in the entire chain, not one metric in isolation.
How to Operationally Track Inquiries, Opportunities, and Outcomes
For a $2M to $10M roofing company, tracking must be simple, repeatable, and non negotiable. Use these operational rules.
Inquiries: Every phone call, web form, text, or social message is logged in your CRM with date, source campaign, and contact details. No inquiry is allowed to bypass the system. Combine repeat contacts for the same project into one opportunity record so you do not inflate lead counts.
Qualified Opportunities and Stages: When your team confirms that a contact fits your service area, job type, and decision maker criteria, mark it as a qualified opportunity and move it into a structured sequence of stages. Track appointment booked, inspection completed, estimate delivered, contract signed, job completed, and payment collected as separate fields or pipeline stages.
Outcomes, Cancellations, and Attribution: After each appointment and each stage, your rep or coordinator updates the same record with sold or not sold, cancellation status, contract value, and reason if not sold. Preserve Unknown as a valid source when attribution is missing. Investigate missing attribution without inventing a campaign or blocking accurate recording of a signed job. Use one consistent attribution method and avoid giving multiple channels full credit for the same sale.
Pro Tip: Assign one operations or sales coordinator to audit records weekly. If a job is installed without a source or with unclear stages, send it back for correction. That discipline protects your marketing budget and keeps your scorecard trustworthy.
Common Performance Measurement Mistakes Roofers Make
Managing vendors on CPL alone. This rewards cheap leads, not profitable jobs, and hides poor conversion quality.
Mixing different sources into one bucket. Digital or online is not a source. You need campaign level clarity such as Google Search, Facebook Retargeting, or Door Hangers.
Not tying sold jobs and completed jobs back to the original campaign. Without this, you cannot calculate cost per sold job, marketing cost per completed job, or true return by channel.
Ignoring follow up. Leads are treated as one and done. There is no structured nurture, rehash, or second look at older inquiries that could still close or complete.
Relying on how it feels. Sales reps like certain leads and dislike others, but the numbers often tell a different story when you look at sold jobs, completed jobs, and contribution after marketing.
Five Concrete Action Steps to Improve Your Tracking
Standardize your definitions. Document what inquiry, qualified opportunity, appointment booked, inspection completed, estimate delivered, sold job, completed job, and source mean in your company and train every office and sales team member on them.
Implement a simple Lead to Job Scorecard. One sheet, by campaign, showing inquiries, qualified opportunities, appointments, inspections, estimates, sold jobs, cancellations, completed jobs, revenue, media cost per lead, total marketing cost per lead, cost per sold job, marketing cost per completed job, and contribution after marketing, reviewed at least monthly.
Tag every record with a campaign source. Add required fields in your CRM so a job cannot move to sold or completed without a source and campaign attached. Preserve Unknown as an option when the true source is not clear, and work to reduce Unknown over time.
Align vendors and internal teams to outcome based metrics. Share your definitions and make it clear that you will evaluate campaigns based on cost per sold job, marketing cost per completed job, contribution after marketing, and fit with your capacity, not just lead volume or cost per lead.
Schedule a quarterly performance review. As the owner, sit down with your leadership team and partners such as ActivatorSystem to decide what to scale, fix, or cut based on cost per sold job, contribution after marketing, and how quickly inquiries progress to completed jobs and payments collected.
FAQs: Cost Per Sold Job and Related Metrics
1. What is a good cost per sold job for a roofing company?
There is no single benchmark that applies to every roofing company. Allowable acquisition cost depends on your average job size, contribution per job after selling and delivery costs, sales compensation, overhead, cash flow needs, and desired profit. The practical question is how much you can invest to acquire a completed job while still meeting your contribution, overhead coverage, and profit targets, and how that level of spending fits your cash position and capacity.
2. Should I stop tracking cost per lead altogether?
No. Cost per lead is still useful as a diagnostic metric, but it should not be your primary decision metric. Use cost per lead to compare how efficiently campaigns generate inquiries, while using cost per sold job, marketing cost per completed job, and contribution after marketing to decide where to allocate budget.
3. How often should I review cost per sold job?
At a minimum, review it monthly by campaign, and make sure you are comparing inquiry groups that have had enough time to reach outcomes. Do not divide this month's advertising spending by this month's contracts when those contracts came from earlier inquiries. Many owners at your scale also review a rolling 90 day view to smooth out timing differences. During heavy spend periods, weekly check ins on the Lead to Job Scorecard help you catch issues early. If a campaign has no sold jobs yet, show No sold jobs yet alongside spending to date and the number of unresolved opportunities.
4. What if my CRM is messy and we do not trust our data?
Then your first project is data hygiene. Start with the last 60 to 90 days. Clean up sources, stages, outcomes, and contract values. Put in place required fields and simple workflows going forward so that inquiries, opportunities, sold jobs, completed jobs, and payments are consistently recorded. The goal is to build a foundation where future decisions are made on reliable numbers.
5. How do repeat and referral jobs fit into cost per sold job?
Treat new referred customers as part of your new customer acquisition flow and include them in your full customer acquisition cost calculations for the referral channel, allocating referral program and relationship management costs consistently. Track repeat customers separately using an explicitly defined repeat or reactivation metric. Report the marketing and sales spending required to reactivate or retain existing customers outside of new customer CAC so you can see both how efficiently you acquire new customers and how effectively you generate additional revenue from your installed base.
6. Can I use cost per sold job to evaluate my sales team as well?
Yes, indirectly. When you track opportunities, stages, sold jobs, completed jobs, and payments by rep and by campaign, you can see which reps convert which types of leads best and how quickly. That informs training, territory planning, and routing rules. The goal is to match the right leads to the right reps and process so that your acquisition cost, contribution per completed job, cash collection, and capacity stay aligned.
Next Step: See Your True Cost Per Sold Job
If you are investing real dollars into marketing but are not sure what you are paying per sold job or per completed job, that is a solvable problem. ActivatorSystem works specifically with roofing and exterior contractors to connect advertising, follow up, and search into an integrated client acquisition system that pays attention to acquisition cost, contribution from completed work, cash collection, and the capacity of your team.
Share your current marketing spend and basic campaign data, and we can help you see your true cost per sold job, marketing cost per completed job, and where the biggest opportunities lie. You can start that conversation here: request a strategy consultation with ActivatorSystem.